
2017 IT Salary Survey
Jobs and compensastion picture improves for IT Professionals
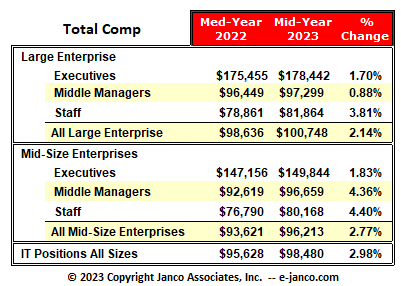
 There is a narrow gap between the average pay of senior executives, midlevel managers and even IT staff. Considering the salaries some hot skills are commanding, that's not surprising. Money isn't necessarily the make-or-break issue in whether a worker leaves a job. Improving relationships between worker and boss, and more closely aligning the worker with the agency mission can "balance or even trump" the limits on monetary compensation. Companies clearly can't ignore worker satisfaction with their salaries - not only those highly skilled IT workers, but also their bosses can surely make a statement with their feet.
The Janco Associates, Inc. salary survey draws on data collected throughout the year by extensive internet-based and completed survey forms sent to businesses throughout the United States and Canada. Our database contains over 30,000 data points.
The 160 page compensation study summarizes and compares data from 78 American metropolitan areas and 23 Canadian cities. Delivered in PDF format, it provides comparative information on more than 70 specific job titles:
- Five distinct IT executive positions
- Three director-level jobs
- More than 15 specific manager roles
- Dozens of technical staff positions
IT Salary Survey
Order Salary Survey Download Salary Survey Sample
Compensation Year to Year Comparison
Demand for IT Jobs
The compensation study (155 plus pages) in PDF or WORD and EXCEL with the data) can be ordered here
Order Salary Survey Download Salary Survey Sample
If you do not want to purchase the full salary study, you can get just the data for a particular city for a fraction of the cost of the full study. Just click here to see all the cities covered or select your city fROM the order page.
Salary Survey Methodology
![]()
From the Janco Associates, Inc. datbase, compensation benchmark ranges are established for each normalized job position. In analyzing the study data, the upper and lower quartiles are eliminated to determine Benchmark Ranges. The benchmark ranges are then used to assess the alignment of a company's actual compensation to the marketplace for each job function. The results can be assessed using the following guidelines.
The Benchmark represents our assessment of the compensation level required for organizations to remain competitive and minimize the risk of losing employees to other organizations.Below Benchmark Range - Highly impacted by forces of the marketplace
Within Benchmark Range - Subject to the normal forces of the marketplace for similar job functions and responsibilities.
Above Benchmark Range - Not subject to the forces of the marketplace
Reviews were conducted from the standpoint of a comparison o base salary and, when appropriate, from the additional standpoint of total compensation. Total compensation is determined by adding the budgetary bonus amounts and an equivalent cash value for above-standard compensation to an individual's base salary.
The compensation Study data was divided into two categories. Large companies are companies whose gross revenues are equal to or greater than $500MM. Mid-sized companies are companies whose gross revenues are less than $500MM.
Cities Included in Salary Survey
Order Salary Survey Download Salary Survey Sample
US Cities Included
![]()
| Akron | Albuquerque | Allentown | Anchorage |
| Atlanta | Atlantic City | Austin | Baltimore |
| Bellingham | Boise | Boston | Buffalo |
| Charleston | Charlotte | Cheyenne | Chicago |
| Cincinnati | Cleveland | Colorado Springs | Columbus |
| Dallas | Denver | Des Moines | Detroit |
| Duluth | Gary | Grand Rapids | Green Bay |
| Honolulu | Houston | Indianapolis | Kansas City, MO |
| Las Vegas | Lexington | Little Rock | Los Angeles |
| Louisville | Madison | Memphis | Miami |
| Milwaukee | Minneapolis | Nashville | New Orleans |
| New York | Oakland | Oklahoma City | Olympia |
| Omaha | Orange County CA | Orlando | Peoria |
| Philadelphia | Phoenix | Pittsburgh | Portland, ME |
| Portland, OR | Provo/Orem | Raleigh-Durham | Rockford |
| Sacramento | Salt Lake City | San Antonio | San Diego |
| San Francisco | San Jose | Seattle | Sioux Falls |
| St. Louis | Stamford | Syracuse | Toledo |
| Topeka | Tucson | Tulsa | Washington |
| Wichita | Winston-Salem |
Canadian Cities Included
![]()
| Calgary, AB | Charlotte, PE | Edmonton, AB | Fredericton, NB |
| Guelph, ON | Halifax, NS | Hamilton, ON | Hull, QC |
| London, ON | Montreal, QC | Niagara Falls, ON | Ottawa, ON |
| Quebec City, QC | Regina, SK | Saskatoon, SK | St. John's, NF |
| Sudbury, ON | Toronto, ON | Vancouver, BC | Victoria, BC |
| Whitehorse, YT | Windsor, ON | Winnipeg, MB | |
Positions Included in Salary Survey
![]()
Executive Management
VP - Chief Information Officer, VP - Chief Security Officer, VP - Administration, VP - Consulting Services, VP - Information Services, VP - Technical Services, Director - IT Planning, Director - Production/Data Center (Operations), Director - Systems & Programming
Middle Management
Manager - Applications, Manager - Computer Operations, Manager - Customer Service, Manager - Data Communications , Manager - Database , Manager - Information Center, Manager - Internet Systems, Manager - Network Services, Manager - Op Systems Prod, Manager - Production Services, Manager - Production Support, Manager Quality Control, Manager - Security and Workstations, Manager - Systems and Programming, Manager - Technical Services, Manager - Training Documentation, Manager - Voice Data Communication, Capacity Planning Supervisor, Change Control Supervisor, Computer Ops - Shift Manager, Computer Ops - Shift Supervisor, Data Entry Supervisor, Production Control Specialist, Production Services Supervisor, Project Manager - Applications , Project Manager - Distributed Systems, Project Manager - Network Techical Services, Project Manager - Systems, Supervisor - Hardware Installations, Supervisor - Desktop Support, Supervisor - Network Services, Voice/Wireless Communications Manager, Webmaster
Staff
Change Control Analyst, Computer Operator, Data Center Facility Administrator, Data Entry Clerk, Data Security Administrator, Database Specialist, Disaster Recovery Coordinator, e-Commerce Specialist, Forms and Graphics Designer, Hardware Installations Coordinator, Internet developr, IT Planning Analyst, LAN Applications Support Analyst, Librarian, Network Control Analyst, Network Services Administrator, Network Technician, Object Programmer, Operations Analyst, Personal Computer Specialist, Production Control Analyst, Programmer/Analyst, Senior Network Specialist, Software Engineer, Systems Analyst, Systems Programmer, Systems Support Specialist, Technical Services Specialist, Technical Specialist, Voice/Wireless Communications Coordinator, Web Analyst
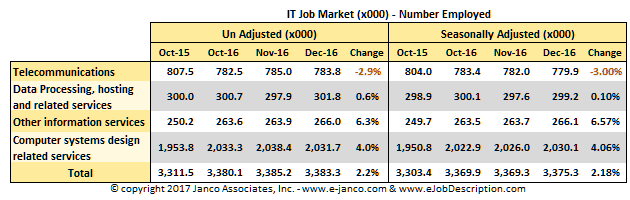
Demand and Employment Data for IT Professionals
National Employment Report
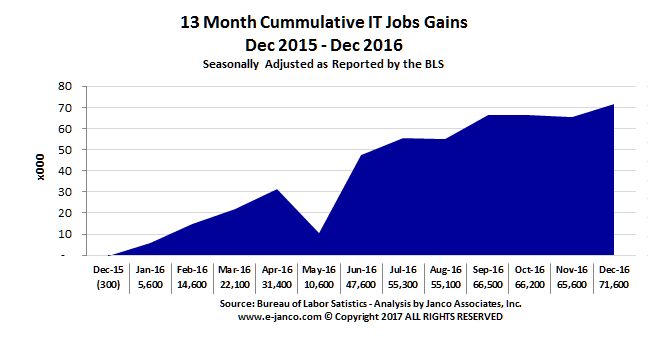
Demand for IT postions has exploded in the last 3 months.
Purchase Options for IT Salary Survey
![]()
The 159-page compensation study summarizes and compares data from 78 American metropolitan areas and 23 Canadian cities. Delivered in PDF format, it provides comparative information on more than 70 specific job titles:
- Five distinct IT executive positions
- Three director-level jobs
- More than 15 specific manager roles
- Dozens of technical staff positions
Become A Survey Participant
Janco Associates, Inc. has published a bi-annual information technology compensation survey for over ten years.
Participate by providing us valid data and we will be able to download a complimentary copy of the summary results1 upon its completion. In addition, you may be eligible to purchase the full study at a significant discount.
These results will be available in January. To participate, simply click the Participate button below and complete the on-line Compensation Participation Survey.
